In today's data-driven world, the ability to analyze, visualize, and share insights from data is invaluable for businesses of all sizes. Power BI, a suite of business analytics tools from Microsoft, has emerged as a leading solution in this space, offering powerful features that enable users to transform data into actionable insights easily.
This blog post is designed to introduce beginners to Power BI, covering its key features, benefits, and how it stands out from other data visualization tools.
What is Power BI?
Power BI is a collection of software services, apps, and connectors that work together to turn your unrelated sources of data into coherent, visually immersive, and interactive insights. Whether your data is a simple Microsoft Excel workbook or a collection of cloud-based and on-premises hybrid data warehouses, Power BI lets you easily connect to your data sources, visualize (or discover) what's important, and share that with anyone you want.
Key Features of Power BI
1.) Data Integration
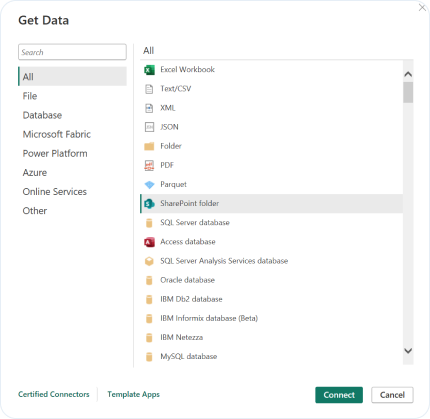
- Power BI allows users to import data from a wide variety of sources, including cloud-based services, streaming data, and local files.
2.) Customizable Dashboards & Interactive Reports
- Power BI combines the functionality of customizable dashboards and interactive reports into a powerful feature set. Users can create personalized dashboards by pinning visuals from different reports, providing a consolidated view of the most important metrics at a glance.
Power BI combines the functionality of customizable dashboards and interactive reports into a powerful feature set. Users can create personalized dashboards by pinning visuals from different reports, providing a consolidated view of the most important metrics at a glance.
3.) DAX Data Analysis Function
- Power BI uses Data Analysis Expressions (DAX), a formula expression language, to perform complex data analysis tasks, enhancing the depth of data exploration.

4.) AI Integration
- Power BI integrates with Microsoft's AI capabilities, allowing users to access image recognition and text analytics, create machine learning models, and more.
Benefits of Using Power BI
- Ease of Use: Its user-friendly interface makes it accessible for users with varying levels of expertise to create reports and dashboards.
- Real-Time Insights: Power BI's real-time dashboard updates allow businesses to make decisions based on the latest data.
- Secure Publishing and Sharing: It offers robust security features that ensure data is protected when sharing reports and dashboards within or outside your organization.
- Cost-Effectiveness: Power BI provides a powerful set of tools at a competitive price point, including a free version and the Power BI Pro subscription for more advanced users.
How Power BI Compares to Other Data Visualization Tools
Data visualization tools are essential for interpreting complex data and making informed decisions. Among the leading tools in this domain are Power BI, Tableau, and Qlik Sense. Here's a simple table comparing the three:
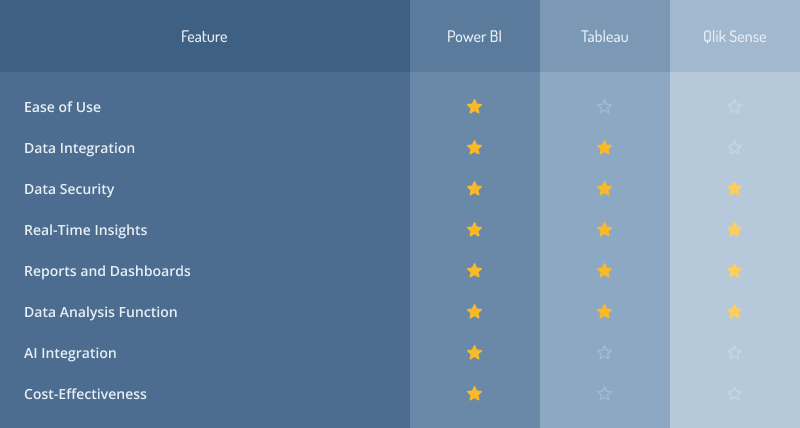
While Power BI, Tableau, and Qlik Sense are all effective data visualization tools, they cater to different needs and preferences. Power BI is often favored for its ease of use, AI capabilities, and cost-effectiveness. Tableau and Qlik Sense are preferred for their sophisticated data analysis and integration features, although they come with higher complexity and cost.
Remember, these comparisons should help guide a bigger evaluation based on what your company specifically needs and uses.
Getting Started with Power BI
Starting with Power BI is straightforward. Here's how you can begin:
1.)Sign Up: Visit the Power BI website and sign up for a free account or the Pro trial to explore more advanced features.
2.)Download Power BI Desktop: For a more feature-rich experience, download Power BI Desktop. It's free and offers additional capabilities for data analysis and report creation.
3.)Explore Data: Connect to your data sources and begin exploring your data. Power BI supports a wide range of data sources, from Excel spreadsheets to databases and cloud services.
4.)Create Reports and Dashboards: Use Power BI's drag-and-drop functionality to create reports. Then, pin visuals to a dashboard for a consolidated view of your key metrics.
5.)Share Your Insights: UShare your reports and dashboards with others in your organization. With Power BI service, you can publish your insights to the web, enabling decision-makers to access real-time data from anywhere.

Power BI is a powerful tool that democratizes data analytics, making it accessible to users with varying levels of expertise. By providing the ability to easily connect to data sources, create interactive reports, and share insights, Power BI empowers businesses to make informed decisions based on real-time data. Whether you're a beginner or looking to expand your data analytics skills, Power BI offers a comprehensive set of features to meet your needs.
As you embark on your Power BI journey, remember that the key to success in data analytics is continuous learning and experimentation. Happy analyzing!